
Including the most recent, five periods of significant employment contraction in the United States have occurred over the past forty years. According to non-farm payroll data supplied by the Bureau of Labor Statistics, U.S. non-farm employment figures have averaged 2.3 percent reductions in labor from peak to trough during the prior four cycles. Most recently, employment fell 6.4 percent before beginning to rebound.

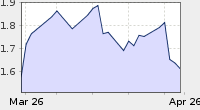
A comparison of indexed oil prices during the 50 months subsequent to peak employment reveals that oil is currently trading within the band of price movements seen over the prior four employment cycles (i.e. 1974 to 1976, 1981 to 1983, 1990 to 1993, and 2001 to 2005). We used 50 months because that is how much time has elapsed since the most recent employment peak of January 2008. America still needs another 5 million jobs before it surpasses this prior peak. As the red line in the graph above denotes how oil prices are tracking to the previous cycle, and considering America's thirst for crude, the likelihood for oil prices to meander closer toward the upper-end of the band appears plausible as the country continues to recover.
In absolute terms, peak to trough reductions averaged 2.3 million workers in past cycles. During the recent downturn, which started in January 2008, 8.8 million employees were cut from the count by February 2010. Despite adding nearly 3.5 million jobs since the trough, hiring needs to increase by another 5.3 million before the country surpasses its previous peak in employment levels.

We have all heard that at the current pace of monthly employment gains it will take several more years to fully recover. While this may be true, what gets missed is that after 24 months of expanding employment, February's non-farm employment was 2.7 percent higher than trough levels. The previous two employment cycles only needed gains of 1.6 percent and 2.2 percent, respectively, to return to full recovery.

Without getting into a history lesson, most comparisons between the current economic situation (while sub-par) and the Great Depression are more hyperbole than factually justified. Non-farm employment dropped by 7.6 million from 1929 until 1933. According to the 1930 Census, the labor force in total was 44.9 million. Combined, these figures suggest that the initial employment drop during the Great Depression was three times the magnitude of what we recently faced.
Employment did not fully recover until America entered World War II (in 1941), or roughly 12 years after the stock market crash. If the employment situation continues to recover at its current pace, the span from prior to peak to when employment surpasses those levels could be around 2015 or almost 7 years. Conversely, three of the past four employment cycles took less than 3 years on average to fully recover.
Refreshing Memories
When President Barack Obama first took office, his administration passed the American Recovery and Reinvestment Act of 2009. This stimulus package grew to cost $840 billion, in which the objective of these funds was to create jobs. According to recent documents, over $749 billion of the funds have been distributed. If we very generously assume that these funds resulted in every job gained since the recent trough, then the cost per individual job gained subsequent to passage of the act is $243,267. If we take the average recovery from past cycles and net this figure against the current number of jobs recovered, then only 1.1 million jobs would likely be due to the Recovery Act. In this second example, each job "created" by the stimulus actually costs $751,174. Either way, these costs seem outrageous regardless of how many jobs were created.
And, the truth is we will never know how many jobs were created by this stimulus because the tracking and reporting was configured in such a manner to make the task impossible using government data! Here is the actual text from the frequently asked questions section of the recovery website:
Why can't I find the total number of jobs funded under the Recovery Act?
A: Recipients only report job numbers by quarter. To total the quarters would be misleading and inaccurate because some of the jobs span quarters, so they would be counted more than once. And, some recipients only report the job in the first quarter but mistakenly believe that they don't have to report the same job in subsequent quarters.
Don't you love the way the answer places the blame for inaccurate tracking on the recipients of funds? Here is the link if you want to explore.
Having spent much of his career in the oil patch, Trey Cowan is a seasoned Wall Street analyst providing insights on both onshore & offshore oil field services. Email Trey at tcowan@rigzone.com


No comments:
Post a Comment