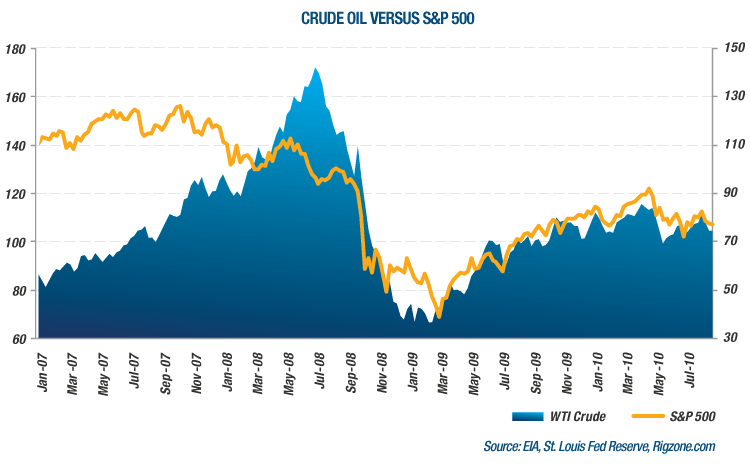
Historically, correlation of oil prices and the U.S. stock market has not shown much commonality. The ten-year average correlation between the two is just +0.10. However, recent trading patterns (comparing West Texas Intermediate Crude and the S&P 500 Index) starkly contrast the longer term trends. Specifically, correlation measured over the past 26-week period is +0.81 or 6% higher than the annual average correlation of +0.76.
Last week we highlighted a similar phenomenon occurring between the U.S. dollar and the price of oil. We observed that oil's inverse correlation to dollar also has a tighter relationship of late. With traders now getting stronger signals regarding oil's direction from the dollar and the S&P 500, leading economic indicators may trump oil fundamentals when the signals are incongruent.

Taking a glass half empty approach raises a cautionary flag when correlation strengthens across the board like we are starting to see here. Diversification of risk is harder to achieve when various asset classes (in this case crude oil, the domestic stock market, and the U.S. dollar) appear to be strongly correlated. A pattern like this developing leaves little cover for investors should other asset classes fall prey to this trend.


No comments:
Post a Comment